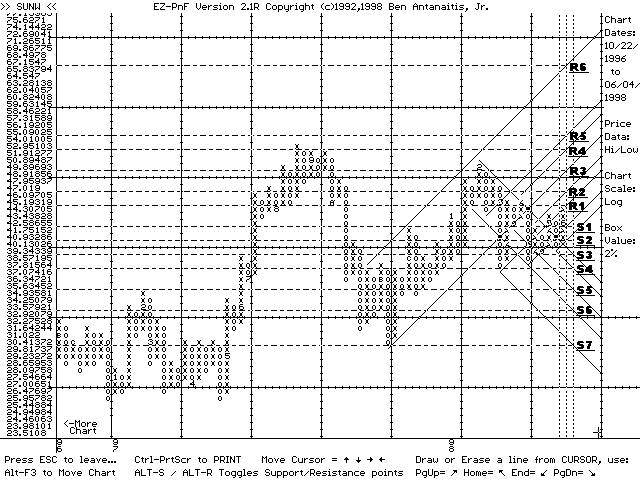
EZ-PnF V2.1 Sample chart of SUNW (06/04/98):

Notes:
- The chart is a 3 box reversal Point and Figure chart.
- The chart is based on daily high and daily low prices.
- The chart is a 2% logrithmic chart, ie each chart box represents a price change of 2% of the value of the box above or below it.
- Seven possible support prices and six possible resistance prices are shown, as well as the support/resistance lines.
- A 'resistance' or 'support' point is a price where an issue's upward or downward price movement may 'stall'. The ultimate result of the 'stall' may be either a continuation or a reversal of price movement, depending on whether there are more or less sellers than buyers at the specific price point.
- SUNW is in a bullish trading trend within an overall bullish trading channel. The current uptrend column ('X') has given a second buy signal to confirm the overall trading channel change to bullish. The current vertical count price objective is $52.25. Resistance may be seen at points R1 through R6. Support may be seen at points S1 through S7. Support point S2 must hold to preserve the overall bullish trading channel.
| Return to BCA Software home page. | Return to EZ-PnF Chart Table. |
(Disclaimer, please read)