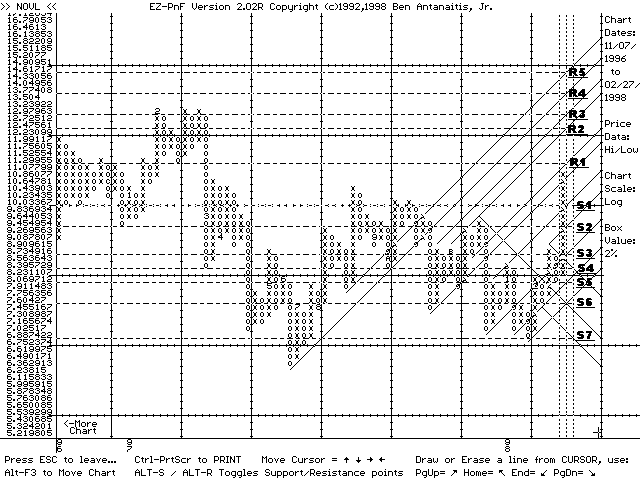
EZ-PnF V2.0U Sample chart of NOVL (02/27/98):

Notes:
- The chart is a 3 box reversal Point and Figure chart.
- The chart is based on daily high and daily low prices.
- The chart is a 2% logrithmic chart, ie each chart box represents a price change of 2% of the value of the box above or below it.
- Seven possible support prices and five possible resistance prices are shown, as well as the support/resistance lines.
- A 'resistance' or 'support' point is a price where an issue's upward or downward price movement may 'stall'. The ultimate result of the 'stall' may be either a continuation or a reversal of price movement, depending on whether there are more or less sellers than buyers at the specific price point.
- NOVL is now tradinging in an overall bullish trading channel. Currently, NOVL has given a second 'buy' signal and is in an uptrend column ('X'). NOVL has, however, reached it's inital vertical count Price Objective of $10.75 and resistance at point R1 may be hard to overcome without a pullback. Resistance may be seen at points R1 through R5. Support may be seen at points S1 through S7. S6 must hold to preserve the overall bullish trading channel.
To return to EZ-PnF home page, click here.
(Disclaimer, please read)